
Solar Panel Cost in 2026: What You’ll Actually Pay
| Solar Panel Cost in 2026 = $2.20 and $3.66 per watt installed |
If you’ve been searching for solar prices, you’ve probably noticed every site gives you a different number. One says $31,000. Another says $20,000. A third subtracts a tax credit that, in 2026, no longer exists for most homeowners.
This guide gives you one clear number, explains why other sites disagree, and covers the one change most cost guides haven’t caught up with: the federal tax credit homeowners used to count on is gone for cash and loan purchases. By the end, you’ll know what you’ll actually pay and how to get the best price.
Quick Answer: What Solar Costs in 2026
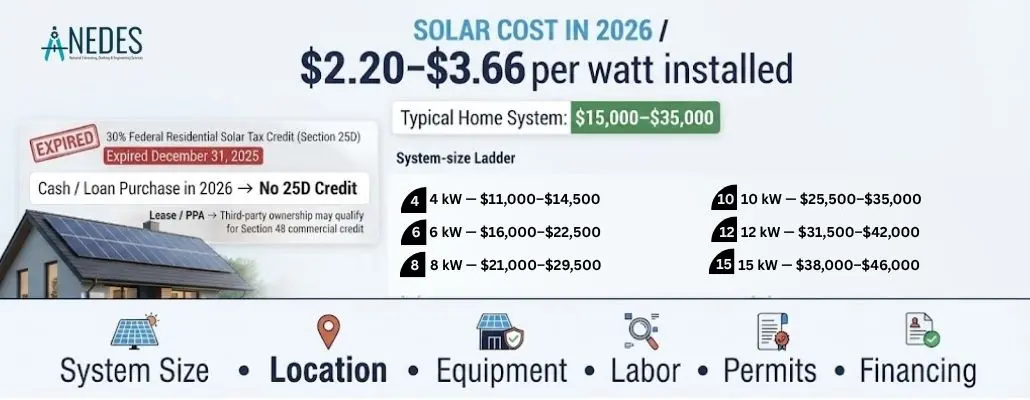
Solar panels cost between $2.20 and $3.66 per watt installed in 2026, before any incentives. For a typical home, that works out to roughly $15,000 to $35,000 for a full system, depending mostly on size and location.
Here’s the part that catches a lot of people off guard: that number is no longer reduced by a 30% federal tax credit if you’re paying cash or using a loan. That credit expired at the end of 2025. If you’ve seen a “solar cost after tax credit” figure somewhere else recently, it may be based on old rules. We’ll explain exactly what happened and what still helps lower your cost, right below.
Is There Still a Federal Solar Tax Credit in 2026?
No, not for most buyers. The 30% federal tax credit for homeowner-owned solar systems expired on December 31, 2025. If you’re paying cash or using a loan in 2026, there’s no federal credit to claim. The one exception is a lease or PPA, covered below. Here’s the full picture.
Section 25D Expired on December 31, 2025
The federal tax credit homeowners have used for over a decade, officially called Section 25D, was worth 30% of your total project cost. It applied if you bought your system with cash or on a loan and placed it in service by December 31, 2025.
That credit ended on that date, with no phase-down and no exceptions for early 2026 installs. If your system is placed in service in 2026 or later and you own it outright, you cannot claim it. This was confirmed directly by the IRS’s guidance on the Residential Clean Energy Credit, which states plainly that the credit is not available for property placed in service after that date.
In simple terms: a $30,000 system that used to effectively cost $21,000 after the credit now costs the full $30,000 if you’re buying it yourself with cash or a loan.
The One Exception: Lease and PPA Financing
There’s a second federal credit, Section 48, that applies to commercially owned solar systems, not homeowner-owned ones. This credit didn’t expire and is still active.
Here’s how that matters to you: if you go the solar lease or Power Purchase Agreement (PPA) route, a financing company owns the system, not you. That company can still claim the 30% commercial credit and typically passes some of that value along to you in the form of a lower monthly payment.
This is now the only practical way a 2026 solar customer sees any benefit from a 30% federal credit, and it’s a meaningful shift in how cash, loan, and lease options compare. We’ll walk through exactly how that changes the math in the cash vs. loan vs. lease section below.
What Still Lowers Your Cost
The federal purchase credit is gone, but you’re not starting from zero. A few things still meaningfully reduce what you pay:
- State tax credits and rebates, which vary widely and are tracked in the DSIRE database of state and utility incentives, a free, government-backed resource for looking up what’s available where you live
- Sales tax and property tax exemptions on solar equipment, common in many states
- SRECs (Solar Renewable Energy Certificates), which pay you for the electricity your system produces in states that support them
- Net metering, which credits you for excess power sent back to the grid
- Point-of-sale rebates for related upgrades, such as an electrical panel upgrade needed to support solar, which can knock a few thousand dollars off that specific line item
Stack a few of these together, and your net cost can still land meaningfully below the sticker price, even without the old federal credit. Just don’t expect a flat 30% off anymore unless you’re going the lease or PPA route.
Why “Average Cost” Figures Vary So Much Between Sources
Once you start comparing solar cost guides, you’ll notice the totals rarely agree, even when the price-per-watt numbers look almost identical. There are two actual reasons for this, and neither one means someone is lying to you.
The first reason is the tax credit issue above. Some guides still quote a post-credit “net cost” using rules that no longer apply to purchased systems. If a site subtracts 30% from the total without explaining that this only works for a lease or PPA now, its final number will look artificially low.
The second reason is assumed system size. Two sources can agree almost exactly on price per watt, say $2.60 versus $2.78, and still land on total-cost figures that differ by 30% or more, simply because one assumes a 6kW system and the other assumes an 8kW system. Neither number is wrong. They’re just describing different-sized systems.
The fix for both problems is the same: don’t anchor on someone else’s total. Use this simple formula instead:
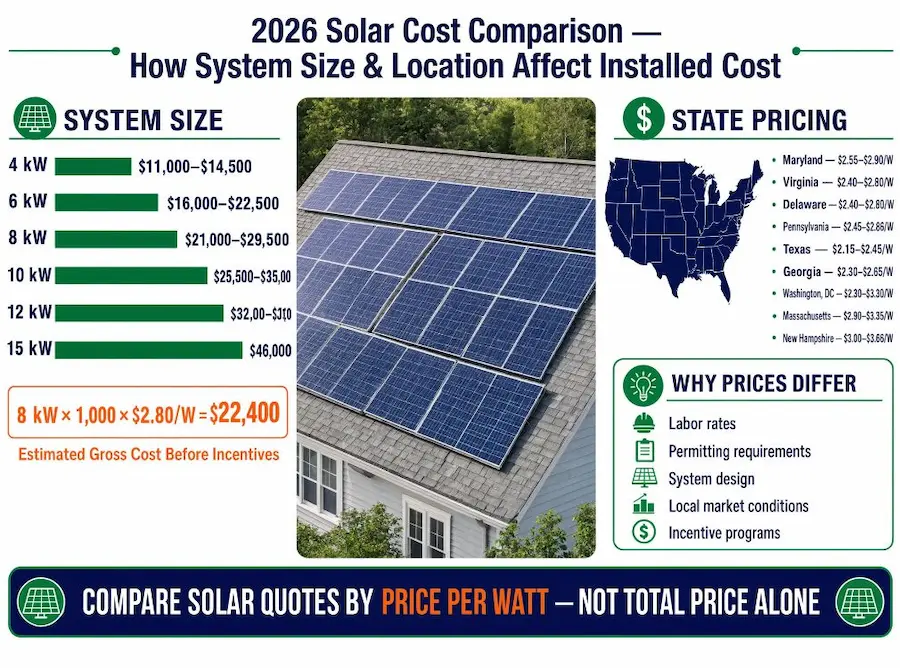
System size (in kW) × 1,000 × price per watt = your estimated total cost
So an 8kW system at $2.80 per watt comes out to roughly $22,400, before any state incentives. Once you know your own rough system size, based on your actual electricity usage, this formula gives you a number that’s actually yours, instead of a stranger’s average.
How Much Does Solar Cost by System Size in 2026?
A typical 6kW–10kW home system costs $16,000 to $35,000 in 2026, before incentives. How many solar panels you need matters a lot, since it’s the main driver of your total cost. Here’s what typical systems run at 2026 pricing, before state incentives (remember, no federal credit applies unless you choose a lease or PPA):
| System Size | Typical Cost Range (Gross) | Homes This Usually Fits |
| 4 kW | $11,000 – $14,500 | Small home, low usage |
| 6 kW | $16,000 – $22,500 | Average starter system |
| 8 kW | $21,000 – $29,500 | Typical US home |
| 10 kW | $25,500 – $35,000 | Larger home, full offset |
| 12 kW | $31,500 – $42,000 | High usage or added EV/heat pump |
| 15 kW | $38,000 – $46,000 | Large home, EV, and heat pump combined |
Notice that the price per watt drops as systems get bigger. That’s because certain costs, like the permit, the design, and the initial site visit, stay roughly the same no matter the system size, so they get spread across more panels. This is also why comparing two quotes by total price alone can be misleading if the systems aren’t the same size. Compare by price per watt instead.
How Much Does Solar Cost by State?
Solar costs anywhere from about $2.50 to $3.66 per watt depending on your state, with cheaper states like Texas and Pennsylvania on the low end and higher-labor-cost states like New Hampshire and Massachusetts on the high end. Labor rates, permitting requirements, and local incentive programs all shift the number, sometimes by close to $1 per watt between states.
| State | Price per Watt | Typical Payback Period | Notes |
| Maryland | $2.55 – $2.90 | 7–10 years | Strong SREC market + MSAP grants; high solar demand state |
| Virginia | $2.40 – $2.75 | 9–14 years | Net metering protected statewide; strong Dominion market growth |
| Delaware | $2.50 – $2.80 | 8–11 years | Utility rebates (Delmarva, DE Electric Coop) still active |
| Pennsylvania | $2.45 – $2.80 | 9–10 years | Active SREC market; no state rebate but strong net metering |
| North Carolina | $2.20 – $2.55 | 9–11 years | Top-4 US state for installed solar capacity; Duke PowerPair rebate |
| Texas | $2.15 – $2.45 | 11–14 years | No state income tax, lowest per-watt pricing among high-demand states |
| Georgia | $2.30 – $2.65 | 9–11 years | Low electricity rates offset by strong installer competition |
| Washington DC | $2.30 – $3.20 | 7–9 years | Highest price per watt but fastest payback due to high electricity rates + SREC + net metering |
| New Jersey | $2.70 – $3.30 | 6–8 years | Strong state incentive stack |
| Connecticut | $2.75 – $3.20 | 8–10 years | State green-bank financing options |
| Rhode Island | $2.85 – $3.30 | 7–9 years | Upfront state rebate available |
| Massachusetts | $2.90 – $3.35 | 7–9 years | High electricity rates speed up payback |
| Maine | $2.90 – $3.35 | 8–11 years | Full 1:1 net metering |
| Vermont | $2.95 – $3.40 | 11–14 years | Strong net metering, lower usage rates |
| New Hampshire | $3.00 – $3.66 | 8–10 years | High electricity rates offset higher install cost |
What’s Included in Your Solar Cost? (Component Breakdown)
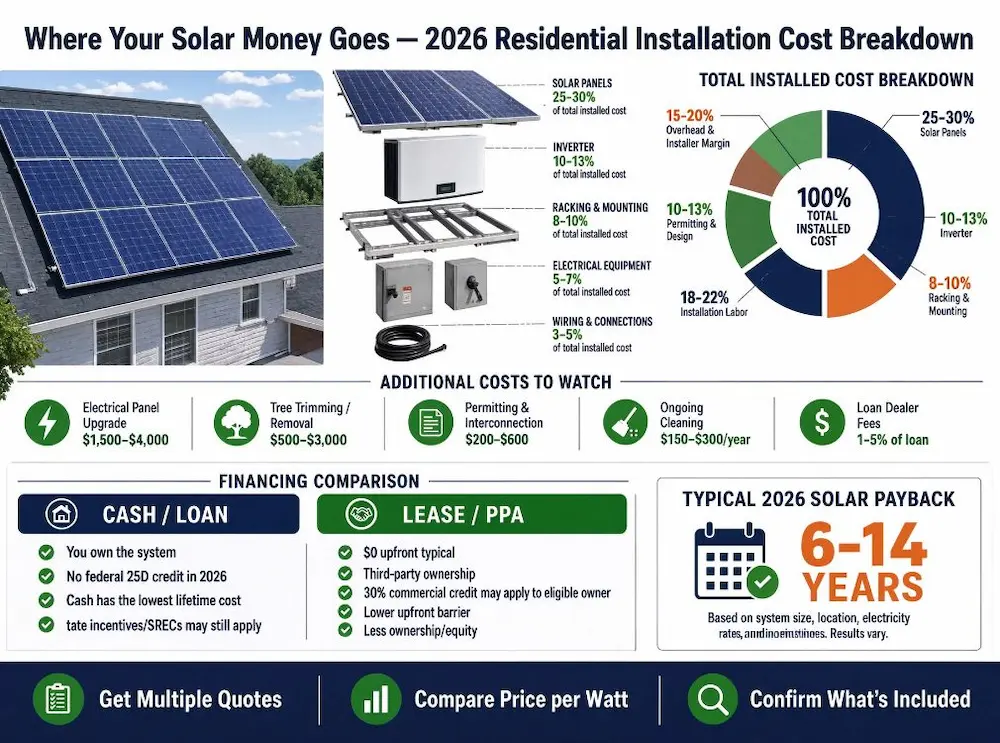
Panels typically make up only 25–30% of your total cost. The rest goes to the inverter, mounting hardware, labor, permitting, and the installer’s overhead and margin. Here’s the full breakdown.
| Component | Typical Share of Total Cost |
| Solar panels | 25–30% |
| Inverter | 10–13% |
| Racking and mounting hardware | 8–10% |
| Installation labor | 18–22% |
| Permitting and design | 10–13% |
| Overhead and installer margin | 15–20% |
Note: Some federal cost benchmarks that isolate only the bare panel modules put this figure closer to 12%. The 25–30% used here reflects how most installers quote bundle panels with related mounting hardware as “equipment,” which is the more useful comparison when you’re reading an actual quote.
Entry, Mid, and Premium Panel Pricing Tiers
Panel choice adds one more layer of variation on top of everything above:
- Entry-tier panels run close to the lower end of the price-per-watt range and are a solid choice for most homes
- Mid-tier panels, often domestically manufactured to meet current sourcing requirements, typically add $0.05–$0.10 per watt
- Premium panels, higher efficiency and longer warranties, typically add $0.15–$0.30 per watt over entry-tier options
Higher-efficiency panels make the most sense when roof space is limited, and you need to fit more output into a smaller area. If you have plenty of roof space, entry-tier panels are often the more cost-effective choice.
Cost Per Watt or Cost Per Square Foot: Which One Matters?
Price per watt matters more. It accounts for how efficient the panels are, which cost per square foot ignores. You may occasionally see solar pricing compared by roof square footage instead. That number can be misleading on its own.
A high-efficiency system might use less roof space but cost more per watt. A lower-efficiency system might cover more of your roof for a similar total price. If you’re comparing two quotes, use price per watt as your baseline. It removes the confusion that roof space alone can create.
Are Solar Panel Prices Going Up or Down in 2026?
Prices are going up in 2026, not down, but only modestly. Installed solar prices rose by roughly $0.15 per watt following 2025’s federal policy changes, an increase of about 5% for projects that include battery storage. Two forces are behind this:
- First, sourcing requirements tied to where components are manufactured have tightened supply for some panel and battery models, pushing costs up slightly.
- Second, financing rates have been easing, which can offset part of that increase for anyone using a loan; each 1-point drop in a loan’s interest rate is roughly equivalent to a $0.15 per watt price reduction over the life of the loan.
It’s also worth being clear about one thing: installer margins can’t simply absorb the lost 30% federal credit. That margin doesn’t exist as extra room in a typical quote; it’s what keeps installation businesses running, so it isn’t something that quietly disappears to make up the difference for you.
Given this modest upward trend, locking in your price sooner rather than later for solar installation in the US can work in your favor, especially if you’re already leaning toward going solar this year.
What Hidden and Additional Solar Costs Should You Budget For?
The most common ones are electrical panel upgrades, roof repair, tree removal, and loan dealer fees. A base solar quote doesn’t always include these. Ask about each one before signing:
| Hidden Cost | Typical Range | Notes |
| Electrical panel upgrade | $1,500 – $4,000 | Needed if your panel is rated below 200 amps |
| Roof repair or replacement | Varies by roof | Recommended first if under 10 years of life left; doing it after installation costs 2–3x more |
| Tree trimming or removal | $500 – $3,000 | For shading issues |
| Permitting and interconnection fees | $200 – $600 | Filing fees only; design costs separate. |
| Ongoing cleaning | $150 – $300/year | Mainly needed in high-pollen or high-dust areas |
| Loan dealer fees | 1–5% of loan (sometimes higher) | Most commonly overlooked cost; rolled into the loan principal instead of shown separately. Ask your lender for the APR including this fee |
Should You Pay Cash, Take a Loan, or Choose a Lease/PPA for Solar in 2026?
Cash or a loan saves you more money long-term if you can afford it; a lease or PPA is the better choice if you want $0 down or still want access to a 30% credit. This decision looks different in 2026 than it did a few years ago, mainly because of the tax credit change covered earlier.
Cash or Loan (You Own the System)
Paying cash results in the lowest total lifetime cost, since there’s no interest and no dealer fee. A loan spreads the cost over 10–25 years but adds interest, and sometimes a dealer fee, on top. Either way, you own the system and remain eligible for any state incentives, SRECs, and net metering, but you do not get a federal tax credit, since the 30% purchase credit expired.
Lease or PPA (A Company Owns the System)
With a lease, you pay a fixed monthly amount. With a PPA, you pay for the electricity the system produces, similar to a utility bill. In both cases, a financing company owns the system, which means it can still claim the 30% Section 48 commercial credit and typically passes some of that value to you through a lower monthly payment. You put $0 down, but you give up ownership, and you generally don’t qualify for state incentives or SRECs yourself, since those usually go to whoever owns the system.
For homeowners without a lot of upfront cash, or those who specifically want access to the remaining 30% federal credit in some form, a lease or PPA is now genuinely more competitive than it used to be. For homeowners who can pay cash or qualify for a low-interest loan, ownership still tends to produce more savings over 20–25 years, just without a federal credit cutting into the upfront number the way it once did.
See our “buying vs. leasing solar panels” guide for a full side-by-side comparison based on your own numbers.
What Is the Payback Period for Solar?
Nationally, payback periods for solar in 2026 typically fall between 6 and 14 years, depending heavily on your state, your electricity rate, and which financing option you choose. This is one of the key numbers used to decide whether solar is worth it for your specific home.
Homes in states with high electricity rates, like Massachusetts (around 27–30¢/kWh) or Maryland (around 17–20¢/kWh), tend to see payback on the shorter end of that range, often 6–10 years, because each kilowatt-hour of solar electricity displaces a more expensive kilowatt-hour from the utility. New Jersey runs closer to 16–18¢/kWh, near the national average, but its strong state incentive stack still keeps payback in a similar range. Homes in states with lower electricity rates, like Virginia (around 14–16¢/kWh, below the national average of roughly 18.4¢/kWh), may see payback closer to 12–14 years.
Note: A lease or PPA doesn’t really have a “payback period” in the same sense, since you never fully own the system, but it can still produce savings from day one if your monthly payment is lower than your current electric bill.
See what solar will actually cost for your home. Get a free, personalized NEDES solar quote today.
How to Get the Best Price on Solar (Quote-Comparison Checklist)
The best price comes from comparing multiple quotes correctly, not from finding the single cheapest installer. Once you have a rough number from everything above, use this checklist:
- Get at least 3–4 quotes from different installers
- Compare by price per watt, not total price, especially if system sizes differ
- Confirm every quote covers the same scope: panels, inverter, mounting, wiring, permitting, interconnection
- Check the panel brand and pricing tier, not just the sticker price
- Ask what’s excluded, specifically panel upgrades and roof work
- Ask for the loan APR including any dealer fee, and confirm whether the quote assumes a purchase or a lease/PPA
- Right-size your system to your actual usage from your last 12 months of bills, not a number an installer suggests
A transparent installer will walk you through all of this without hesitation.
Get Your Personalized Solar Cost Estimate!
Every number on this page is a starting point, not your actual quote. Your actual solar installation cost depends on your roof, your usage, your state, and how you choose to finance the system. Get a free quote from NEDES to see what you’d actually pay, with your incentives factored in, so you’re not guessing based on someone else’s average!
Frequently Asked Questions About Solar Panel Cost in 2026
Is there still a federal solar tax credit in 2026?
Not for cash or loan purchases. The 30% Section 25D credit expired for systems placed in service after December 31, 2025. It’s still available indirectly through a lease or PPA, where the financing company secures separate commercial credit and can pass some savings on to you.
How much does a 6kW solar system cost?
A 6kW system typically runs $13,000 to $22,500 before incentives in 2026, or roughly $2.20 to $3.75 per watt depending on your state and equipment choice.
How much does one solar panel cost?
A single residential panel typically costs $200 to $350 before installation. Labor and other installation costs make up most of your total bill, not the panels themselves.
What is a good price per watt for solar panels in 2026?
Anywhere from $2.20 to $3.66 per watt is a competitive, typical range depending on state. If a quote comes in notably above $3.66 per watt without a clear reason, such as a complex roof or premium equipment, it’s worth asking why.
Is it cheaper to buy solar in cash or through a lease/PPA now?
Cash still produces the highest total savings over time if you can afford it, since there’s no interest and you keep any state incentives. A lease or PPA requires no upfront money and is currently the only way to access a 30% federal credit in any form, which narrows the gap compared to a few years ago.
What’s included in a solar installation quote?
A standard quote should include the panels, inverter, mounting hardware, wiring, permitting, and interconnection with your utility. It typically does not include electrical panel upgrades or roof work unless specifically requested.
Are there hidden costs with solar panels?
The most commonly overlooked ones are electrical panel upgrades, roof repair, tree removal, and loan dealer fees rolled into a financing package. None of these are technically hidden, but they’re easy to miss if you don’t ask directly.
Why do average solar cost figures vary so much between sources?
Mainly two reasons: some guides still subtract a 30% federal credit that no longer applies to purchased systems, and different sources assume different average system sizes even when their price-per-watt numbers are nearly identical.
Are solar panel prices going up or down in 2026?
Modestly up in the near term, roughly $0.15 per watt higher following 2025’s federal policy changes, driven mainly by tighter sourcing requirements on some components, partly offset by easing financing rates for buyers using a loan.
What is the payback period for solar without the federal credit?
Typically 6 to 14 years, depending on your state’s electricity rates and which financing option you choose. States with higher electricity rates tend to see faster payback despite the loss of the federal purchase credit.