
Solar Lease vs Cash Purchase vs PPA in 2026
Homeowners who go solar in 2026 face one critical decision before installation: financing structure. According to the U.S. Energy Information Administration (EIA), US residential electricity rates increased at an average of 7% annually between 2020 and 2024. The financing structure determines whether a homeowner saves $8,000 or $80,000 over the system’s life.
According to the U.S. Internal Revenue Service (IRS), the One Big Beautiful Bill, signed July 4, 2025, eliminated the Section 25D residential solar Investment Tax Credit (ITC) for homeowner-purchased systems, effective January 1, 2026. For a $28,000 system, that credit was worth $8,400.
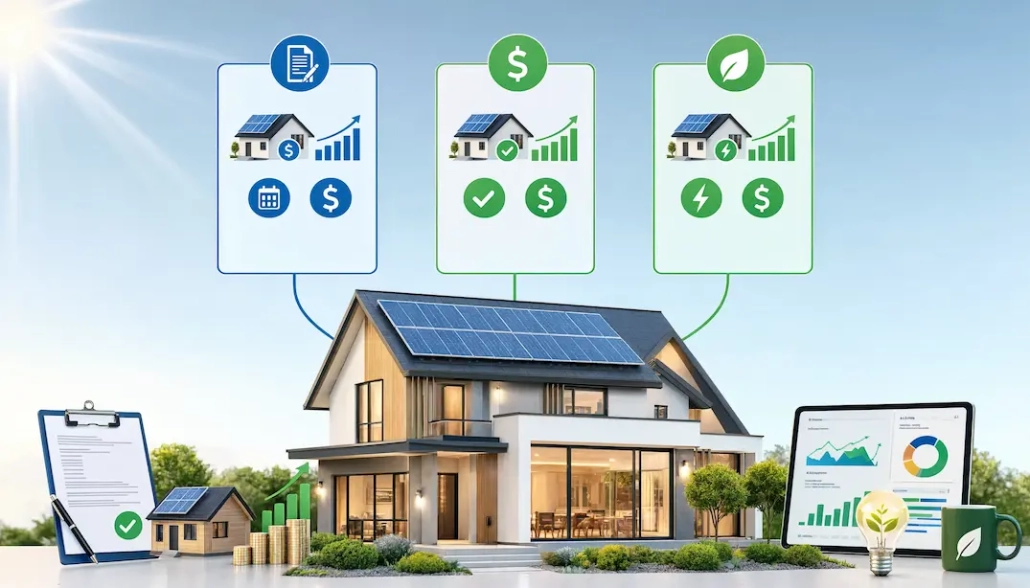
Solar lease, cash purchase, and power purchase agreement (PPA) each place panels on the roof and reduce the utility bill. The financing choice determines ownership, long-term cost, and home resale impact.
What Is the Difference Between a Solar Lease, a Cash Purchase, and a PPA?
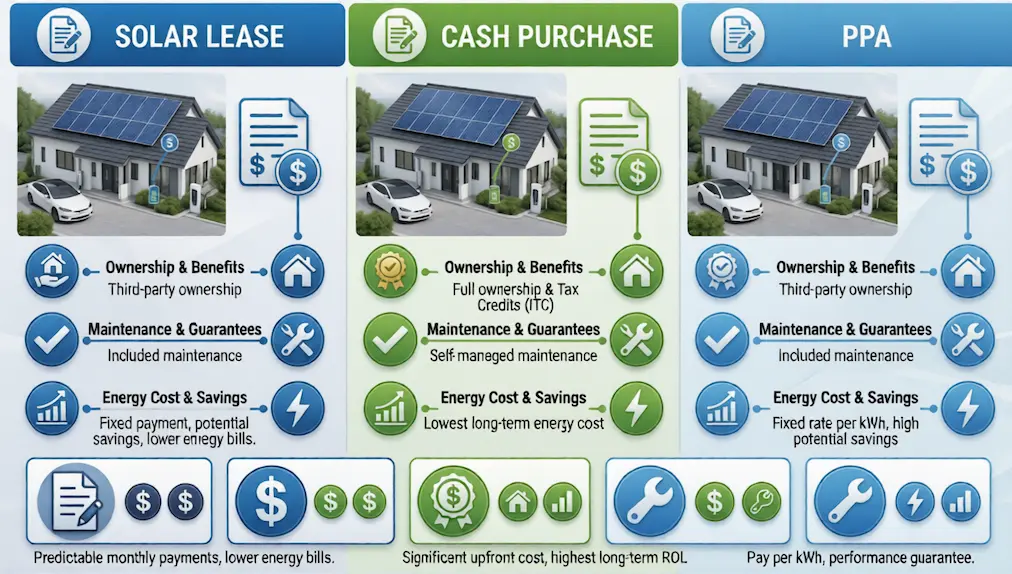
Solar lease, cash purchase, and PPA differ on three factors: system ownership, monthly cost structure, and long-term savings potential.
1. Cash Purchase
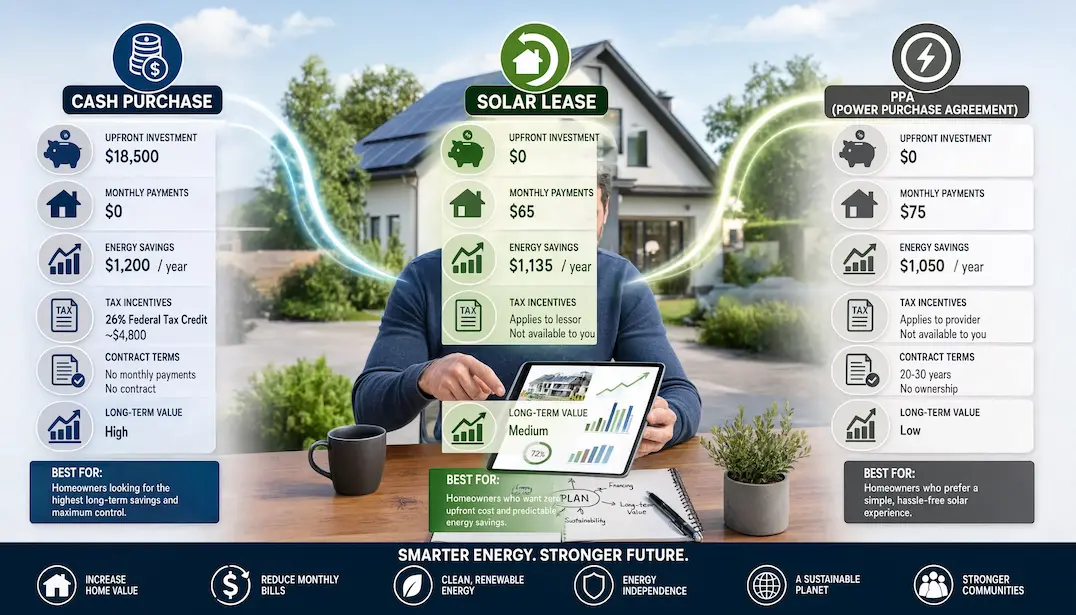
A cash purchase costs $22,000–$35,000 for an 8–12 kW system in 2026, based on 2026 installer pricing data from the Solar Energy Industries Association (SEIA). The homeowner owns all panels, inverters, and energy output. There is no debt, monthly payment, or third-party intermediary. The system adds directly to home value and transfers to any buyer at closing.
2. Solar Lease
A solar company installs the system, owns it entirely, and charges a fixed monthly fee of $75–$200/month for an 8 kW system, regardless of actual electricity production. The homeowner uses the energy; the solar company owns the asset. Solar lease contracts run 20–25 years.
3. Power Purchase Agreement (PPA)
A PPA differs from a lease in payment structure: the homeowner pays a per-kilowatt-hour rate for actual electricity produced, typically $0.17–$0.27/kWh in 2026, which is below most US utility rates. A third party owns the system. Monthly payments increase in high-production months and decrease in low-production months. PPAs are available in approximately 30 states.
| ● Arizona
● Arkansas ● California ● Colorado ● Connecticut ● Delaware ● Georgia ● Hawaii ● Illinois ● Iowa |
● Maine
● Maryland ● Massachusetts ● Michigan ● Nevada ● New Hampshire ● New Jersey ● New Mexico ● New York ● Ohio |
● Oklahoma
● Oregon ● Pennsylvania ● Rhode Island ● Texas ● Utah ● Vermont ● Virginia ● Washington ● Washington D.C. |
How Did the 2025 Tax Law Change the Solar Financing Math?
According to IRS guidance updated January 2026, the Section 25D residential solar ITC was eliminated for homeowner-purchased systems effective January 1, 2026.
The commercial solar ITC (Section 48E) was not eliminated. Solar companies that own systems installed through leases and PPAs retain the 30% commercial ITC through 2027.
Providers that pass a portion of this credit to homeowners reduce effective lease and PPA rates. Cash purchase payback periods extended from 6–8 years (with the 30% ITC) to 9–13 years (without it) for a typical $28,000 system.
Still Unsure How the Old Tax Credit Worked and What Replaced it?
Contact the NEDES team to get details on it and support your decision.
Which Solar Financing Option Saves You the Most Money Over 25 Years?
The following model uses a 10 kW system producing 12,000 kWh annually at the $0.15/kWh average US electricity rate, per 2026 EIA data. All figures reflect the 2026 policy environment with no residential ITC for purchased systems.
| Option | Upfront Cost | Fed. Incentive (2026) | Est. 25-Yr Savings | Own System? |
| Cash Purchase | $22K–$35K | None | $35,000–$50,000 | Yes |
| Solar Loan | $0 down | None | $20,000–$35,000 | Yes (after payoff) |
| Solar Lease | $0 down | Via provider | $10,000–$18,000 | No |
| PPA | $0 down | Via provider | $12,000–$20,000 | No |
| Prepaid PPA | ~70% of the cost | Via provider (48E) | $28,000–$42,000 | Yes (after 6 yrs) |
Cash purchase produces the highest 25-year return. The 2026 solar payback period is 9–13 years without the ITC, extended from 6–8 years when the 30% credit is applied. Homeowners staying longer than 13 years with available capital achieve the highest lifetime savings through cash purchase, but maximizing system longevity requires proper solar panel maintenance.
What Is the “Two Rising Bills” Trap and How Can You Avoid It?
The two rising bills trap costs homeowners up to $307,000 over 25 years when PPA escalators compound alongside rising grid rates.
A PPA at $0.24/kWh with a 3.5% annual escalator compounds to a total 25-year electricity cost of approximately $161,533, versus $24,000–$40,000 for an owned system producing identical output, based on compound interest modeling at current US utility escalation rates.
Many lease and PPA systems are designed to offset only 30–50% of annual electricity usage. The remaining 50–70% of the utility bill continues increasing at the grid rate, currently averaging 7–10% per year (EIA, 2024). A PPA starting at $90/month, combined with a remaining $350 utility bill increasing at 7% per year, produces a combined 25-year cost exceeding $307,000.
Before signing any third-party agreement, require the installer to provide the projected total offset percentage and a 25-year cost model based on the actual utility rate.
Points You Must Consider Before Signing a Lease or PPA
- Confirm the percentage of annual electricity usage the system offsets.
- Confirm the annual escalator rate and total cost at years 10, 15, and 20.
- Verify the contract includes a production guarantee with a financial remedy for shortfalls.
- Identify the buyout price at years 5, 10, and 15.
- Clarify contract transfer procedures if the home is sold and the buyer does not qualify for assumption. If uncooperative lease terms delay a property deal, sellers sometimes choose to invest in professional solar removal and installation services to relocate the system entirely.
How Does Solar Financing Affect Your Home Sale?
Owned solar increases home sale price by an average of 4.1%, while leased solar restricts buyer eligibility and extends time-on-market.
Owned Solar (Cash or Loan)
Homes with owned solar panels sell for an average of 4.1% more. On a $400,000 home, that equals $16,400 in added value. The system transfers to the buyer at closing with no special paperwork or buyer approval requirements.
Leased Solar or PPA
The buyer must assume the remaining contract term, typically 15–20 years.
According to the National Association of Realtors (NAR) 2024 survey, solar lease contracts reduce the qualified buyer pool and increase average days-on-market by 11–18 days.
In cases where the buyer’s credit does not meet the lease provider’s minimum requirements, the seller may be required to buy out the lease at a price set by the solar company. Review the buyout schedule before signing any lease or PPA.
Homeowners selling within 5–7 years face a cash purchase payback period of 9–13 years in 2026. The investment does not break even before the sale. A lease or PPA with precise transfer provisions and a defined buyout schedule is the more cost-effective choice for short-horizon homeowners.
Note: Solar savings vary by state based on net metering policy, utility rate, and system size. Review state-specific economics before selecting a financing structure.
What Is Net Metering and How Does It Change Which Option Wins?
Net metering policy directly determines the financial return on an owned solar system and varies by state and utility provider.
- Under full retail net metering, every excess kilowatt-hour sent to the grid earns a full retail credit — for example, $0.15/kWh — reducing the utility bill dollar-for-dollar.
- Under avoided-cost net metering, exported electricity earns only wholesale rates of $0.04–$0.07/kWh.
- Under California’s NEM 3.0 net billing structure, export rates are low, and the financially optimal strategy shifts to battery storage paired with system ownership.
In states with full retail net metering, ownership produces maximum financial return. In states with reduced export rates, leases become more price-competitive because the ownership advantage on exported electricity decreases.
Note: Net metering policy is actively changing across the US. Review the latest net metering policy in the applicable state before committing to any financing agreement.
Are You Confused Between Your Regional Net Metering Options?
Book your free solar assessment with NEDES today!
What Is the Prepaid PPA: Is It Better Than a Regular Lease or Cash Purchase?
The Prepaid PPA is a third-party ownership structure that qualifies for the Section 48E commercial solar ITC through 2027, with ownership transferring to the homeowner after a 6-year safe harbor period.
How Does the Prepaid PPA Work?
The homeowner pays approximately 70% of the full system cost upfront. This payment can be financed. A third-party provider owns the system for a 6-year safe harbor period and claims the Section 48E commercial solar ITC. Full legal ownership of the panels transfers to the homeowner at the end of the safe harbor period at little to no additional cost.
A regular lease requires monthly payments for 20–25 years with no ownership transfer. A Prepaid PPA requires one upfront payment of approximately 70% of the system cost, with ownership transferring after 6 years. With the residential ITC eliminated for direct purchases, the Prepaid PPA provides homeowners access to federal incentive economics through the provider’s Section 48E credit. Typical payback periods for cash-funded Prepaid PPAs range from 5–7 years.
Note: Equipment selection in a third-party ownership (TPO) arrangement is restricted to the provider’s approved list. Review the approved equipment list before signing, particularly if battery integration is planned.
Book Your Free Consultation Now
What are the Alternative Paths to Cash Ownership?
PACE Financing
Property Assessed Clean Energy (PACE) financing funds a solar system through the property tax bill over 10–25 years. PACE requires no credit check. The property itself secures the loan. The assessment stays with the property on sale.
According to the U.S. Department of Energy’s Office of Energy Efficiency, PACE financing is available in approximately 20 states with rates of 5–8%:
| ● California
● Colorado ● Connecticut ● Florida ● Illinois ● Maryland ● Massachusetts ● Michigan ● Minnesota ● Missouri |
● Nevada
● New Jersey ● New Mexico ● New York ● North Carolina ● Ohio ● Oregon ● Pennsylvania ● Texas ● Virginia |
PACE Financing Risk: PACE liens hold priority over the first mortgage. Mortgage lenders may object, and this priority position complicates refinancing. Disclose a PACE lien to the lender before signing.
Home Equity Loan / HELOC
Using home equity to fund a cash solar purchase produces interest rates of 3–5% in 2026, and interest may be tax-deductible. The home is collateral. The loan must be paid off or transferred at closing on the sale.
Homeowners with significant equity and a 10+ year horizon achieve the lowest effective solar cost through a HELOC in 2026, given the elimination of the residential ITC.
Battery Storage
Battery storage financing is independent of solar panel financing. Under third-party ownership, batteries qualify for the Section 48E commercial ITC through 2027. Lease and PPA contracts typically include battery replacement costs after 12–15 years. Homeowners who purchase outright absorb replacement costs of $5,000–$15,000, depending on the unit.
According to Tesla Energy pricing data (2026), a Tesla Powerwall costs $11,500–$15,500 installed. Under a third-party PPA, the provider covers battery replacement after 12–15 years.
EV Charger Integration
Going solar reduces home EV charging costs. Owned systems are sized to include EV load from installation. Lease agreements may restrict future EV charger installation or system expansion. Homeowners who drive an EV or plan to acquire one factor that load into the system sizing conversation before signing any agreement, making EV charger installation a seamless add-on.
How Do Credit Score, Tax Situation, and Timeline Determine the Right Solar Financing Choice?
System ownership preference, maintenance tolerance, and long-term residency plan each affect the optimal solar financing structure independently of credit score and available capital.
| Your Profile | Best Option | Reason |
| $25K+ capital, staying 10+ years | Cash Purchase | Highest lifetime ROI; full home value addition; no third-party agreement. |
| Good credit (700+), staying 7+ years | Solar Loan | $0 down; homeowner owns the system; home value benefit applies. |
| Credit below 650 or horizon under 5 years | Lease or PPA | $0 down; immediate bill savings; simpler exit if moving. |
| Want ownership with federal incentive access | Prepaid PPA | Provider claims Section 48E credit; savings passed to homeowner; ownership transfers after 6 years. |
| No credit check required; PACE-eligible state | PACE Financing | Property-secured; no credit score requirement; assessment stays with the property on sale. |
Three behavioral factors determine financing fit beyond the financial profile:
- Homeowners who prefer zero maintenance responsibility achieve that outcome through a lease or PPA, which removes all system maintenance obligations.
- Homeowners prioritizing maximum long-term financial return select a cash purchase or a well-priced solar loan.
- Homeowners planning future system additions — additional panels, battery storage, or EV charging integration — select ownership structures, as third-party agreements typically restrict system modifications.
What Are the Red Flags in a Solar Lease or PPA Contract?
According to the Consumer Financial Protection Bureau (CFPB), solar financing complaints rose 38% between 2022 and 2024, with lease and PPA contracts representing the majority of disputes.
Verify each of the following before signing:
- Verify a minimum annual kWh production guarantee with a defined financial remedy for shortfalls. Contracts without this guarantee transfer all underproduction risk to the homeowner.
- Confirm a specific buyout price at years 5, 7, 10, and 15 before signing. Contracts with undefined buyout schedules restrict future sale and refinancing options.
- Require a projected annual offset percentage above 80% of annual household electricity usage—systems designed to offset less than 80% result in significant ongoing utility bill exposure.
- Clarify the buyer’s credit score requirement for contract assumption and the procedure if a buyer does not qualify. Unclear transfer terms are a leading cause of delayed home sales.
- Identify dealer fees separately from the system cost. Solar loan dealer fees range from $3,000–$8,000 and inflate the loan principal above the actual system cost.
Obtain at least three independent installer quotes and request a certified solar installer to model the specific property situation with verified utility rate data—and make sure they handle all local permits and approvals before signing any agreement.
Is Going Solar in 2026 Still Worth It Without the Federal Tax Credit?
Going solar in 2026 produces positive returns in states with full retail net metering, grid rates above $0.14/kWh, and systems sized at 80%+ usage offset.
According to the National Renewable Energy Laboratory (NREL), solar panel costs decreased 90% between 2010 and 2024. State-level incentives in many markets offset a portion of the value lost from the residential ITC elimination.
The calculation is location-specific. A homeowner in Maryland with a $350/month electric bill, full retail net metering, and a 12 kW system produces substantially different 25-year economics than a homeowner in a low-rate state with a 50% net metering export rate. Every year of delay costs the homeowner full grid-rate payments on electricity the solar system would otherwise generate.
About NEDES
NEDES has served homeowners in Maryland, Virginia, and Washington, D.C. for 15 years. The company provides independent solar system analysis matched to individual home load, utility net metering structure, roof orientation, and financial goals.
Our team models cash purchase, solar loan, Prepaid PPA, and phased system options with verified 25-year cost projections for each financing path before any agreement is signed.
Contact NEDES for a 2026 solar assessment.
Frequently Asked Questions
Does Adding Solar Panels Change a Homeowner’s Insurance Premium?
Solar panel installation increases home replacement value by $15,000–$25,000 on average, increasing homeowners’ insurance premiums by $50–$150 annually, according to the Insurance Information Institute. Under a lease, the provider insures the system, leaving the homeowner’s personal premium unchanged.
What Happens if a Solar Lease Provider Goes Bankrupt During a 25-Year Contract?
In prior solar company bankruptcies, including Sunrun portfolio transfers, lease contracts were reassigned to successor management companies under bankruptcy court supervision. Power delivery continuity depends on the successor agreement terms.
Do Solar Leases or PPAs Cover Roof Repair Costs?
Solar leases and PPAs do not cover roof repair costs. Roof repairs require the homeowner to pay the solar provider $2,000–$3,000 to unmount and remount the system, in addition to independent roofing contractor fees.
How Does Solar Panel Degradation Affect PPA Payments Over Time?
According to the National Renewable Energy Laboratory (NREL), solar panels degrade at a median rate of 0.5% per year. Under a PPA, the homeowner pays only for actual kilowatt-hours generated. Lower production results in lower bills unless an escalator clause offsets the degradation effect.
Can Battery Storage Be Upgraded Later Under a Third-Party Lease?
Modifying a leased system is restricted under third-party ownership agreements. Any system expansion or battery addition requires explicit approval from the leaseholder. Unapproved third-party hardware installation is not permitted under standard lease terms.