How Much Power Do Solar Panels *Actually* Produce? (A 2026 Guide)

Have you ever wondered why your solar panels are not generating as much energy as you thought they would? You are not alone. Solar panel output does not only rely on what is written on the label. The hours of actual sunlight to the effectiveness of the system and the climate in the area will each contribute to the amount of solar power generation your house will receive. We will be dissecting the actual figures, professional knowledge and successful tips to optimize your solar energy production in this 2026 guide so that you can convert all your sun rays into direct savings. To maximize your output, you need to understand the concept of solar net metering: what you need to know.
Solar Output: Quick Facts
- The “Sticker Price”: A 400-watt panel does **not** produce 400 watts all day. This is its *peak* rating, achieved only under perfect lab conditions.
- The Real Answer: Your *actual* daily output (in kWh) depends on 5 key factors: your location, roof angle, shade, panel quality, and inverter type.
- The “Bridge”: The only way to know your *true* output is with a professional engineering analysis that models all these factors for your specific home.
Introduction
Wonder what the power output of your solar panels and why it even matters in 2026? The solar panel output you are generating shows the efficiency of your system in converting sunlight to usable energy. It is the secret to determining your system size, savings and ROI. The US EIA shows that the average domestic household in the United States consumes approximately 865 kWh of electricity each month and therefore, knowing output will enable you to make smarter plans.
Nowadays, modern solar energy production is as efficient and rewarding as ever with an average panel of 400-450 W capacity and every ray of sunlight is transformed into actual usable power. To estimate real household usage, check our analysis of how many kWh a house uses per day.
Get Your *Exact* Output & Savings
Don’t guess with online calculators. Get a 100% free, personalized quote to see your exact system size, output, and savings.
What We Will Cover in this Blog?
In this 2026 guide you will discover:

- How solar panel output is measured and why it matters?
- Real-world illustrations of solar energy production by varying sizes and regions of the panels.
- Factors influencing solar power generation including sun hours to panel efficiency.
- The computation of system size, savings and ROI using actual data.
- How to get the best out of your panels and prevent the usual traps?
- Responses to frequently asked questions regarding the amount of electricity that solar panels generate.
Understanding Solar Panel Wattage and Power Ratings
Have you ever thought of what the wattage of a solar panel is? Solar panels’ wattage is the wattage potential of a panel under the standard Test Conditions STC, which are normally full sunlight, optimal temperature and optimum orientation. This rating is a reference point of how much power a solar panel can produce but the actual output is normally different. For real-world energy planning, see residential solar installation guide.
Actual manufacture is usually different from the rated output. Panels typically generate approximately 80 to 90% of the wattage they are rated at because of shading, temperature and the angle of installation among others. This gap is the key to the prediction of the correct solar power generation and the ability to plan the system that is really able to satisfy the power requirements.
Here is a simple example: A 400W panel in the modern world with 4.5 peak sun hours per day will yield about 1.8 kWh/day. Over a month that is more than 50 kWh which is sufficient to run several household appliances depending on the usage.
In the US, the amount of sun that reaches the ground is dependent on the area it is located in on average, 4-6 peak sun hours/day as reported by NREL. This range directly influences the quantity of electricity that your panels will produce and location is a very important aspect when estimating your production and possible savings.
Get a Free Output Analysis Now
Call our team for a free, no-obligation consultation. We can perform a detailed production analysis for your home right over the phone.
How to Calculate Solar Panel Output?

Wonder how much power your panels will produce? The calculation of the solar panel output is not as hard as it sounds with the proper formula. The way to determine the amount of energy produced annually using solar panels has to do with panel wattage, sunlight and system efficiency.
Here is the step-by-step formula:
Energy (kWh/year) = Panel Wattage × Sun Hours per Day × 365 × System Efficiency
- Panel Wattage: The rated power of your panel is for example 400 W.
- Sun Hours per Day: Average daily peak sunlight hours for your location.
- System Efficiency: Accounts for losses due to inverter, wiring, shading and panel orientation typically 75–85%.
Regional sunlight examples:
| Region | Average Peak Sun Hours/Day |
| Arizona | 6.5 |
| Florida | 5.5 |
| New York | 4 |
For example, A 400 W panel in Arizona is 6.5 hours per day at 80% efficiency.
400 × 6.5 × 365 × 0.8 ÷ 1000 ≈ 758 kWh/year
What Factors Affect Solar Panel Output?

In the case of a real-world panel, temperature, shading, orientation and maintenance are all influencing factors. Much as high-quality panels can generate their rated power under ideal environmental conditions, they cannot generate their rated power optimally in favourable environmental conditions.
Knowing the output of solar panels can assist the homeowner and the installer in sizing the system more accurately and predicting the production of electricity. The set of realistic expectations eliminates shock during monthly bills and ROI therefore, solar projects are more reliable.
Temperature Loss
Heat is a factor that degrades panel efficiency. Not all solar panels have a 0.5% per °C and thus hot summer days can reduce production considerably. These losses are reduced by proper ventilation and the selection of low temperature coefficient panels.
Orientation and Tilt
Panels produce maximum power in the south where they face the optimum tilt angle. Flat roofs and misalignment will cause a decline in production by 10-20% of the output, which will affect the amount of electricity that the solar panels produce in a year. It has to be placed well so that it gets as much sunlight as possible.
Shading Losses
One of the largest undercover criminals is shading. Trees, nearby buildings or even half shadows on a panel may cut the output by 10-25%. The shading losses can be reduced by using microinverters or optimizers.
Dirt and Dust
Debris-covered panels minimize power generation. Dust, pollen or debris may accumulate to a level of 2 to 5% cuts in production thus the need to keep the plants clean and in good condition to ensure stable output of solar power.
Panel Degradation
Panels become unproductive with time. The normal degradation rates stand at 0.4-0.6% per annum for example a 10-year-old system can lose 5% compared to a new system. Degradation is an important aspect to consider during long-term solar energy production. Complement output planning with off-grid solar system services.
Real-World Example
How Much Energy Does a Solar Panel Produce?
Wonder how much electricity solar panels can get you? Comprehending the output of energy under realistic conditions of a solar panel can enable the homeowner to make wiser choices regarding the size of the system and savings. We will consider some real-life examples to observe the process of solar energy production.
Case Study 1
Single Panel Output
An average 400 W panel exposed to 5 peak sun hours a day generates about 2000 Wh/day which accumulates to an average of 600 Wh/month. This basic computation indicates how even one panel can make a significant contribution to the energy requirements of households and demonstrates the discrepancy between rated and actual output in the real world.
Case Study 2
Full Residential System
A 15 x 400 W (6 kW) residential system in California can produce approximately 9000 kWh per year. This is much more in line with the US average of 6.5 kW system that will generate an average of 9100 kWh per year and how appropriately sized systems can supply most or all of the electricity demand of a household maximizing ROI and energy autonomy.
Regional Comparison: Solar Output by Location
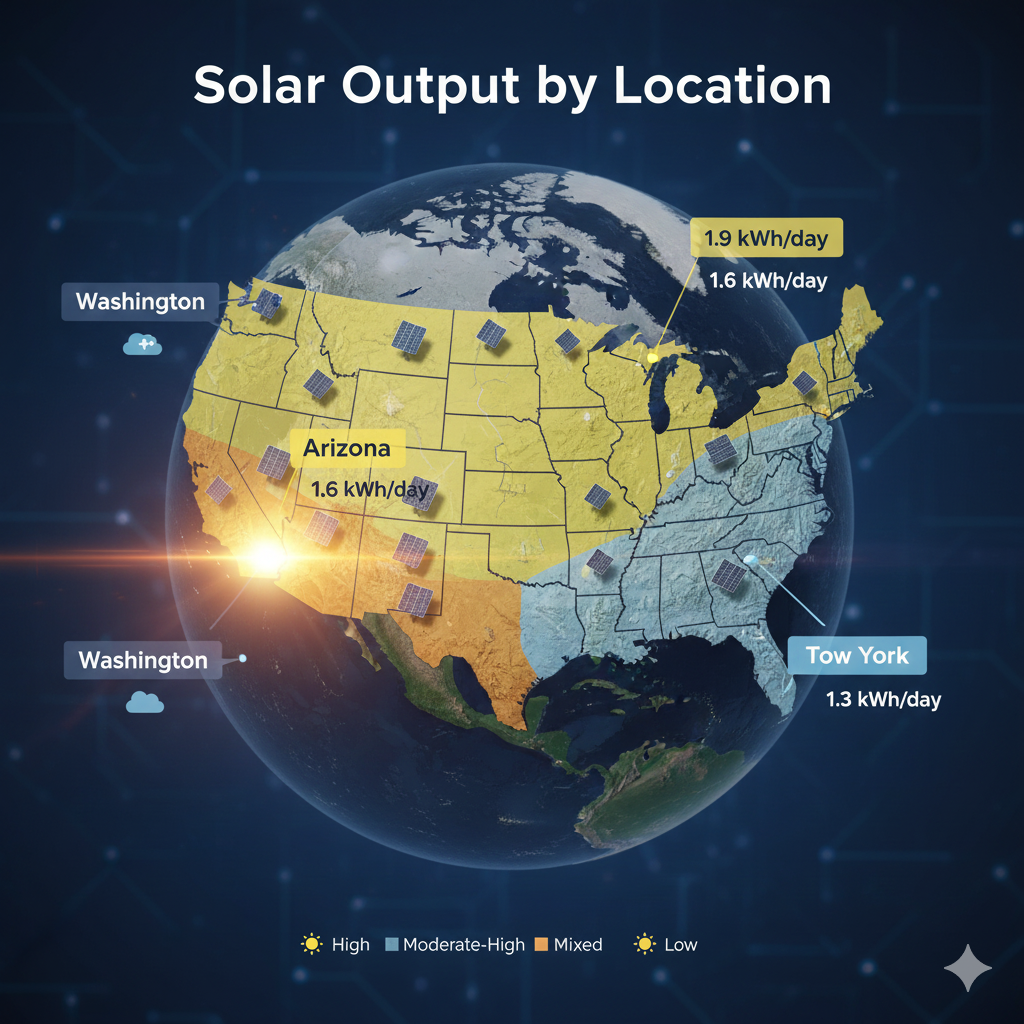
Have you ever questioned what would happen to the performance of your solar panels depending on your location? The knowledge of the amount of energy a solar panel can produce in your state is the key to making the appropriate choice of a system size and to approximating the real savings. The solar panel output in terms of state is highly varied by the amount of sunlight, climate and season which necessitates comparisons at a regional scale to be made to provide accurate projections.
High Sunlight States
Arizona leads in the list of solar energy production. High peak sun hours allow one to expect 1.9 kWh/day of production on a 400 W panel in AZ. Texas and the State of Illinois do not lag far behind with close to 1.6 kWh/day to make them ideal in maximizing the output of a solar panel.
Moderate Sunlight States
Solar production is moderate in New York. A 400 W panel in this case is averaged at 1.3 kWh/day with a short day and cloudy weather in contrast to the Southwest. When there are changes in seasons, it is important to plan so as to have a steady output of solar energy.
Low Sunlight States
Washington experiences reduced production because of cloudy weather. The normal output of panels can be 1.1 kWh/day with a 400 W panel. Although it is still useful, the occupants might require additional panels or additional systems to ensure that electricity requirements in the household are met effectively.
How to Improve and Maximize Your Solar Panel Output?
Should you want to maximize your solar investment? Educating yourself about solar power and taking active steps can go a long way to make your system much more efficient. It is not only the quality of the panel that should be used in proper solar power generation but also prudent maintenance and technological improvements.
Regular Maintenance
It is important to keep panels clean. Dowel panels may lose as much as 20% of efficiency. Consistent solar panel production and avoiding hidden losses of energy will be guaranteed with the help of a quarterly cleaning schedule, attention to your inverter and pruning shading trees.
Advanced Technology
Microinverters or power optimizers have the capability of extracting 5-10% more power through the optimization of each panel separately. Bifacial solar panels also receive light on both sides and generate approximately 10-15% additional output and particularly on surfaces where the panels are placed over light coloured surfaces such as light-coloured roofs or gravel that reflect light.
Smart Monitoring
Monitoring systems and smart apps will assist in determining areas of performance lapse. With the output of each panel monitored, you can easily identify problems such as shading, dirt, or equipment problems and keep your solar generation of power at full efficiency all year round.
Cost, ROI and Payback Based on Output
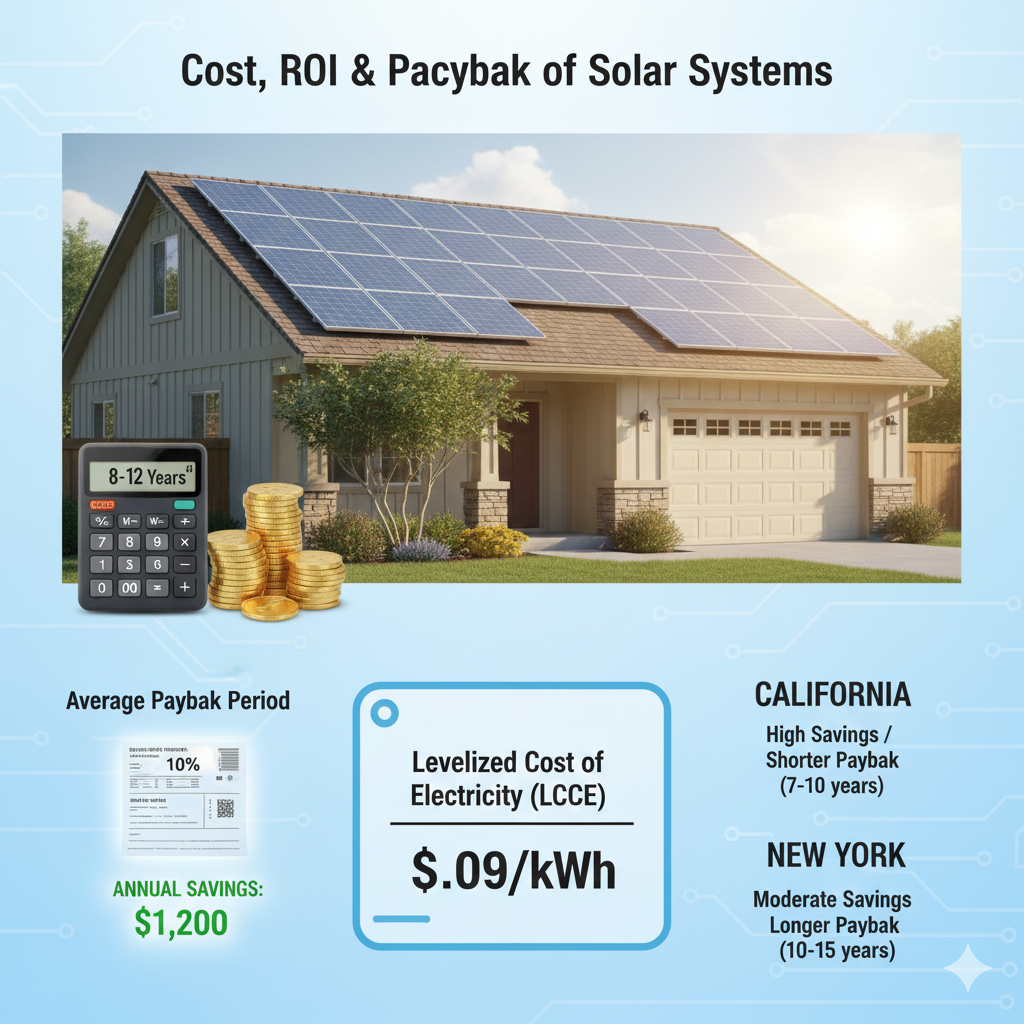
Wonder how many dollars your solar panels will save you? It is always necessary to know solar power generation ROI before investing. The efficiency and production of the system directly reflect on your payback period, and this allows you to plan to save in the long run and be independent of energy.
Example ROI Calculation
A typical residential system of 6kW costs approximately 12000 dollars. The system also attains a payback period of 10 years because it saves 1200 dollars/annually on electricity bills. This shows that solar panel efficiency payback is closely related to actual energy generation.
Regional Cost Variation
Power charges differ depending on the state and impact savings. An example is California or New York where local EIA average rates might result in better ROI than lower-rate states. Inclusion of local variations in finance planning ensures that there is correct financial planning.
Sample LCOE (Levelized Cost of Energy)
The LCOE is estimable using the data of SEIA and EnergySage as:
Total System Cost ÷ Total Lifetime Energy Output ≈ $0.09/kWh.
This calculates the actual cost of energy throughout the life of the system which makes the system more credible and allows the readers to make informed decisions on the output and efficiency of the solar panels. U.S. Department of Energy
Conclusion
The first step in maximizing your investment in solar energy is getting to know the real potential of your system. Solar panel output is determined by the wattage, the peak sun hours and the general efficiency of the system which combined assess the amount of electricity that can be produced and the amount of money that will be saved. With the inclusion of location, maintenance and modern technology, you will be sure that your panels will provide the best solar power generation year-round. National Renewable Energy Laboratory (NREL)
FAQs
How much electricity does a 400 W solar panel produce per day?
+
Depending on location and sun hours of maximum intensity, a 400 W panel normally produces 1.4-2.0 kWh/day. The output changes depending on the seasonal sunlight, the direction of the panels, shading and are useful in estimating the real-world solar energy production to plan the system.
What is the calculation of solar panel energy output?
+
The formula used to compute the output of solar panels is the product of the panel wattage, average daily sun hours and efficiency of the system. This provides daily kWh which can be projected to monthly or annual estimates to plan the solar power production and ROI properly.
Is the weather relevant to solar power production?
+
Yes, weather significantly impacts output. A reduction of 10-25% of production can be caused by clouds, heat, shading and dirt. Knowledge of these effects assists the homeowners in forecasting the real output of solar panels compared to the rated output to be used in credible energy planning.
What is the average amount of energy that was generated by solar panels in one year?
+
A typical 6 kW household-scale system yields approximately 9,000 kWh each year based on sun rays and the orientation of the system and efficiency of the system. Monitoring the annual production of solar energy can be used to estimate the savings and payback time period of various regions in the United States.
How efficient will the modern solar panels be in 2026 on average?
+
The highest modern panels will be 21-23% efficient in 2026. Efficiency impacts the electricity output of a solar panel which determines the size of the system, anticipated output and the overall payback of homeowners and installers.