Residential Solar Installation Cost 2026: Pricing & ROI

Clean energy is in frenzied demand and solar is dominating. As a matter of fact, the residential solar market in the US increased by 40% annually in 2024 and analysts estimate over 7 million residential installations by 2030. However, herein lies the question every house owner is asking: What will be the actual Residential Solar Installation Cost in 2026?
Solar pricing is not a matter of numbers but rather a matter of making a smart home investment that will cut utility bills, add value to the property and provide energy self-sufficiency over the long term. For a detailed step-by-step process, read the ultimate guide for residential solar installation
This blog will take you step-by-step through the average installation cost, the major factors that determine price, financing and ROI to ensure that you are fully aware of what to expect when investing in a home solar system. You will understand why by the end of this time, more families are declaring solar the smartest home upgrade of 2026.
2026 Solar Cost: Quick Facts
- Average Cost: Before incentives, a typical residential solar installation in 2026 costs between $15,000 and $25,000.
- Key Incentive: The 30% Federal Tax Credit is the #1 way to save, reducing the net cost by thousands.
- Payback Period: Most homeowners see a full payback on their investment in 5-8 years, then enjoy decades of free electricity.
- The “Bridge”: The final cost depends on your roof, local permits, and equipment quality. A professional quote is the only way to get an *exact* price.
Introduction
Considering the next move to solar? You’re not alone. By 2026, solar panels will power over 1 out of 10 homes in the United States of America, since the cost of energy will keep increasing. The single most important question is easy and is asked by homeowners about the real cost of solar installation.
The solution is to know the residential solar installation cost. Prices are different but the savings are undisputed: solar can save up to 50 to 90% in utility bills, property values can rise by 4% and decades of energy savings can be guaranteed.
With the 30% Federal Solar Tax Credit and other incentives at the state level, home solar panels have become almost 40% cheaper over the past ten years and solar is not only green but also a financially viable choice.
Get a Free Roof Assessment
Not sure if your roof is right for solar? Our experts can provide a free, no-obligation assessment of your roof’s age, angle, and condition.
Average Residential Solar Installation Cost in 2026
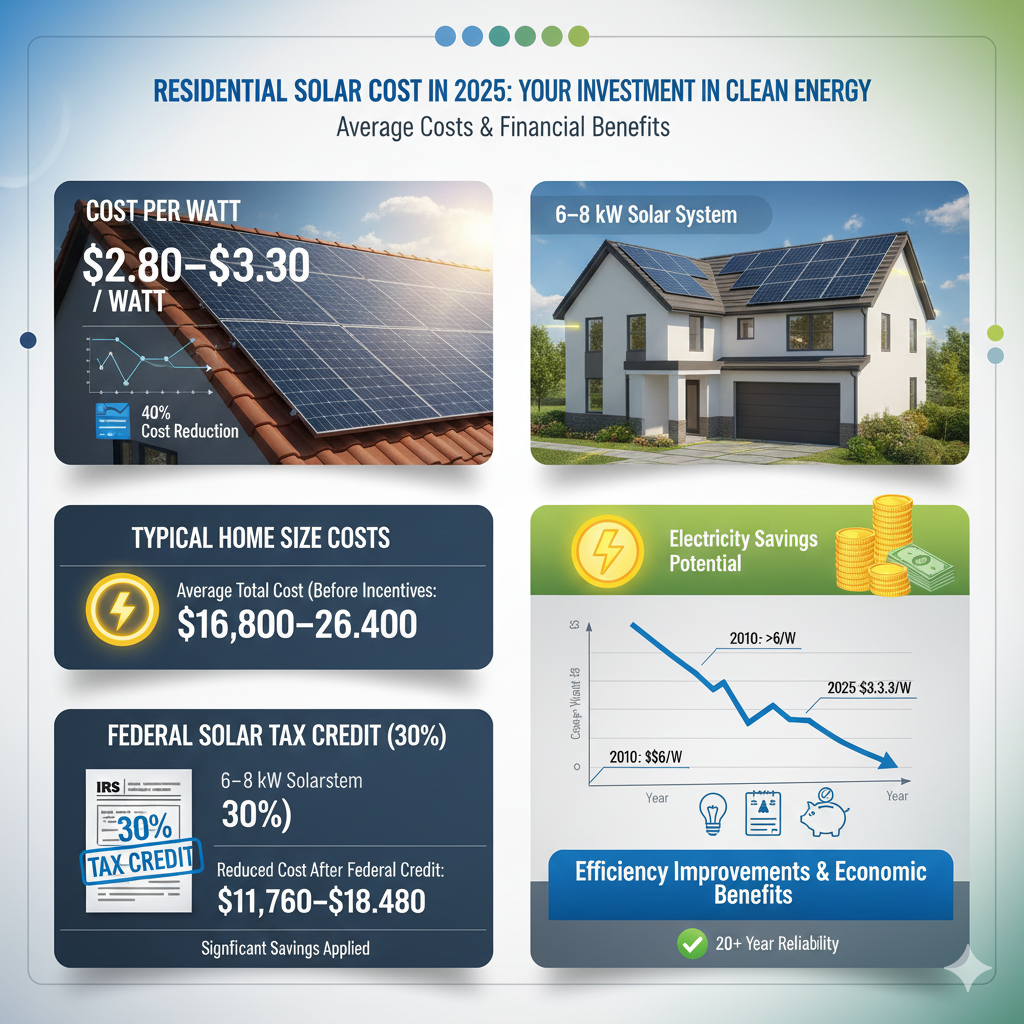
As you know, solar installation pricing is the biggest question nowadays. By 2026, the cost in the country is projected to average between $ 2.80 and $ 3.30 per watt, meaning that solar energy is now less expensive. For a typical home size of 6 kW to 8 kW, this will be between $ 16,800 and $ 26,400 (excluding incentives) before considering system size. Although that was a huge cost and incentives will contribute significantly to the initial cost.
The Federal Solar Tax Credit was recently raised to 30%, which reduces the average homeowner to just $11,760 – $18,480 after applying the credit, saving thousands of dollars instantly on installation. There are also a lot of states that provide extra rebates and net metering, which further reduce the cost.
The long-term price trend is what is particularly exciting about 2026. In 2010, the price of home solar was more than 6 cents per watt. Now jump to the present and the prices of the solar installations have fallen as much as 40% over the last ten years. That translates into more efficient systems at a fraction of the cost to the homeowner and solar is not only a sustainable solution but also a smart economic one.
You claim the 30% credit when you file your federal taxes. The Internal Revenue Service (IRS) provides the official details and requirements for the Residential Clean Energy Credit.
Residential Solar Installation Cost Comparison of 2020 vs. 2026
| Year | Average Cost per Watt | Typical 6 kW System (Before Incentives) | After 30% Federal Tax Credit | Price Trend |
| 2020 | $3.85 – $4.25 | $23,100 – $25,500 | $16,170 – $17,850 | Baseline |
| 2026 | $2.80 – $3.30 | $16,800 – $26,400 | $11,760 – $18,480 | ↓ ~40% over the decade |
Factors Affecting the Cost of Home Solar Panels
Each home solar panel installation varies in cost of home solar panels. A number of major factors affect the pricing and investment in general and learning about them can help homeowners make better decisions.
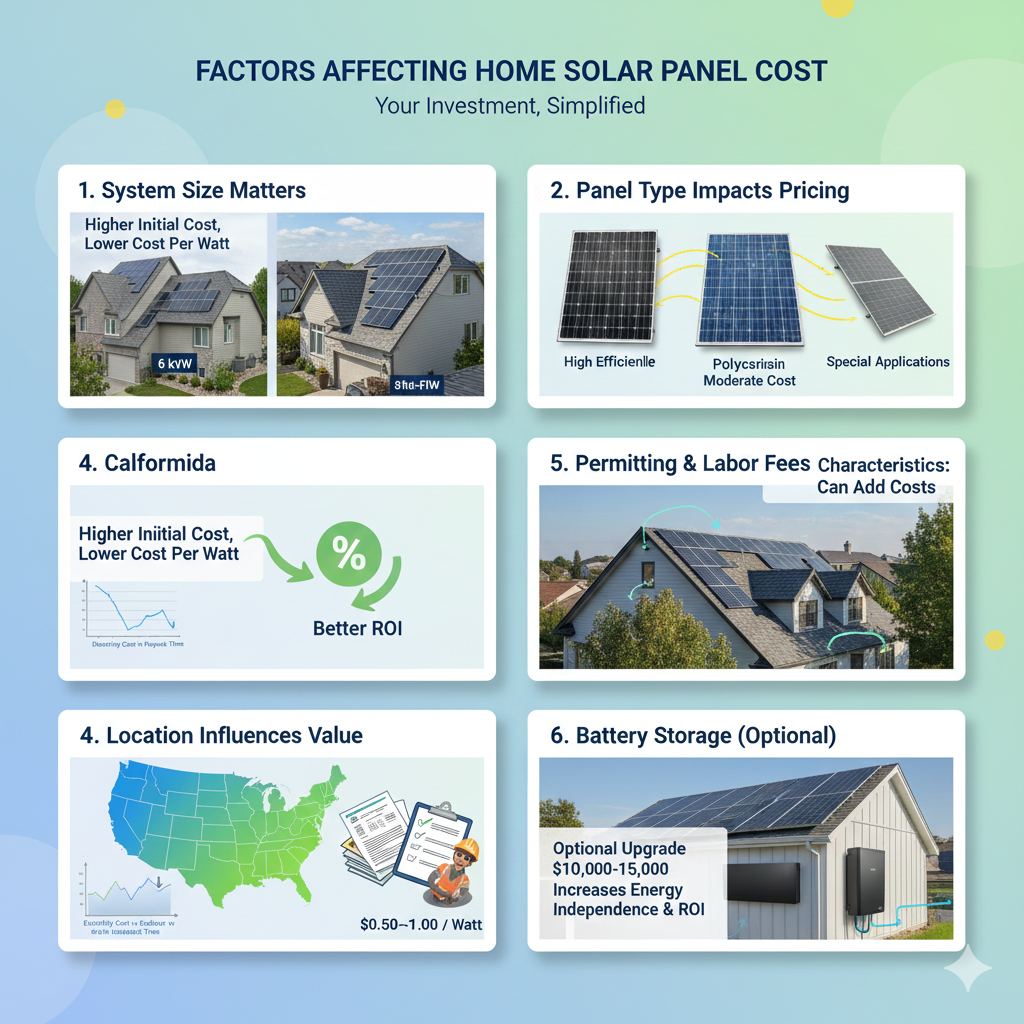
System Size Matters
The larger the system, the greater the initial cost, but there is a silver lining. Larger systems generally make the cost per watt less efficient and so your investment is more efficient over the long run. As an example, a 6 kW system can be upgraded to an 8 kW system, which can also add up to a total of 6000-8000 dollars but will reduce the price per watt by 10-15%.
Panel Type Impacts Pricing
Not every panel is made equal. Monocrystalline panels are high-quality and very efficient, whereas polycrystalline panels are inexpensive but a bit less effective. Thin-film panels are commonly applied in special applications. The selection of the appropriate panel can have a great impact on your home solar system ROI.
Roof Characteristics Can Add Costs
The shape, material, tilt and shade of your roof influence the labor and complexity of installation. A roof that contains many angles or heavily shaded areas can add between 10 and 20% to labor expenses, which has a direct effect on the cost of home solar panels.
Location Influences Value
The cost of electricity varies throughout the US and solar will be better in states such as California, Texas, New York and Florida. The increased utility rates will reduce the time to break even, hence homeowners in these states will be able to recover their investment faster.
Permitting & Labor Fees
Permit, inspection and labor may contribute approximately $0.50–$1.00 per watt. Although these costs are not always given much attention, they are required to adhere to local regulations and have a safe and efficient system.
Battery Storage (Optional)
To become more flexible and independent of energy sources is the addition of a solar battery costs between $10,000 and $15,000. Storage is an optional upgrade but smart to maximize ROI and energy savings in the eyes of the homeowner.
Financing Options for Residential Solar Investment
Concerned with the initial expense? You’re not alone. Making a residential solar investment can be an overwhelming experience and the hassle of going solar can be affordable with some flexible financing programs that enable homeowners to switch to solar without having to empty their pockets.
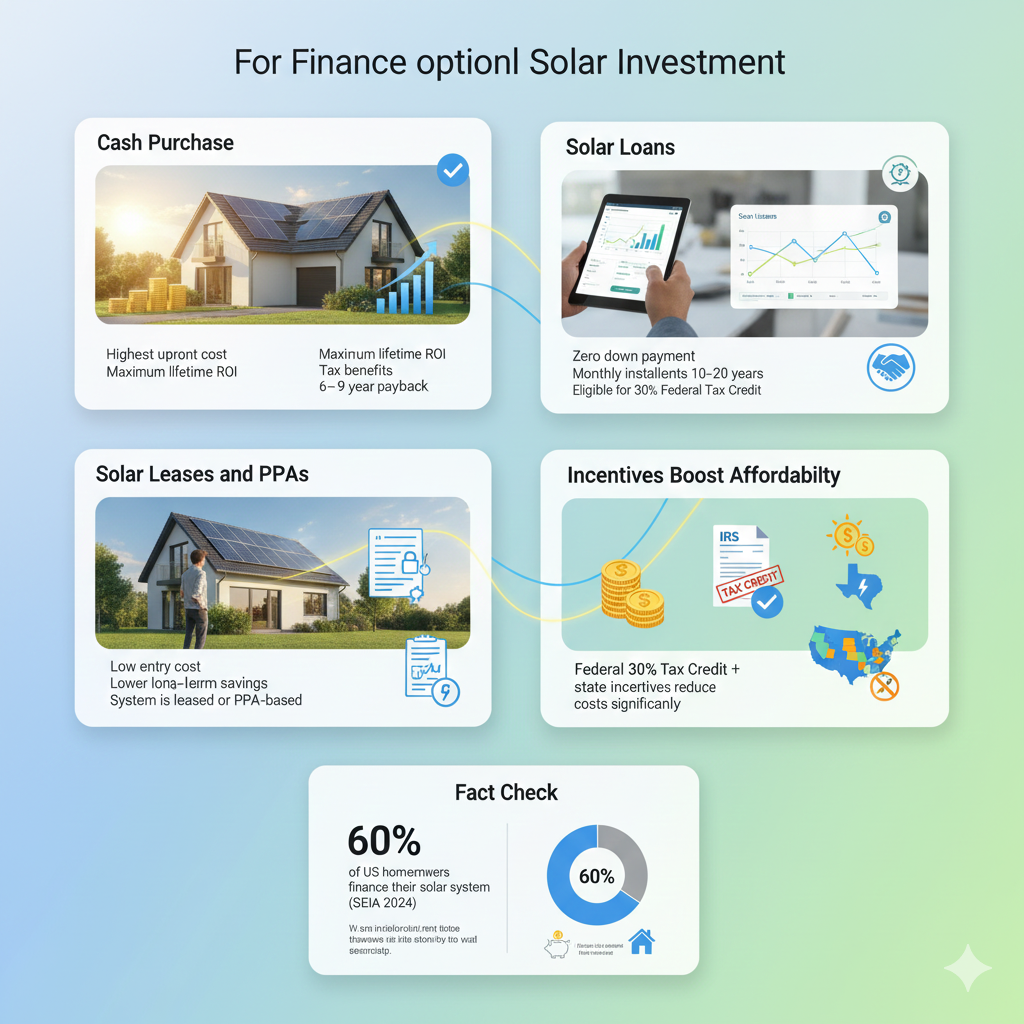
Cash Purchase
Cash payment is the costliest upfront investment, yet it will have the best lifetime ROI. By paying in full, homeowners are able to receive the maximum amount of tax benefits and long-term savings on electricity and their investment is usually recouped in 6-9 years.
Solar Loans
Solar loans enable homeowners to install a system with a zero down payment and a monthly payment of 10-20 years. The low rates and financing available and designed to fund solar, sustain residential solar investment with a loan which will still enable you to claim the 30% Federal Tax Credit.
Solar Leases and PPAs
In case initial expenses are an issue, low entry can be offered through solar leases or Power Purchase Agreements (PPAs). It costs you little or nothing to start with; however, in the long run, the savings are lower than cash purchases or loans because you do not own the system.
Incentives Boost Affordability
Government incentives make solar more affordable than ever. The Federal Solar Tax Credit (30%) will be in effect until 2032 and a state-level incentive such as rebates, SRECs, and net metering, can additionally lower fees. The most generous programs are provided in states like California, New York and Texas.
Fact Check
More than 60% of homeowners in the United States finance their solar system rather than pay cash (SEIA 2024). This statistic proves that structured financing can be the most intelligent method to make a residential solar investment and maximize the benefits.
ROI & Payback Period of Home Solar Systems
How soon will your investment pay? Solar can be one of the best financial choices a homeowner can make today because the home solar system ROI can be impressive. Not only will solar panels save you money on electricity bills every month but energy security in the long term and home value are other benefits that solar panels offer.
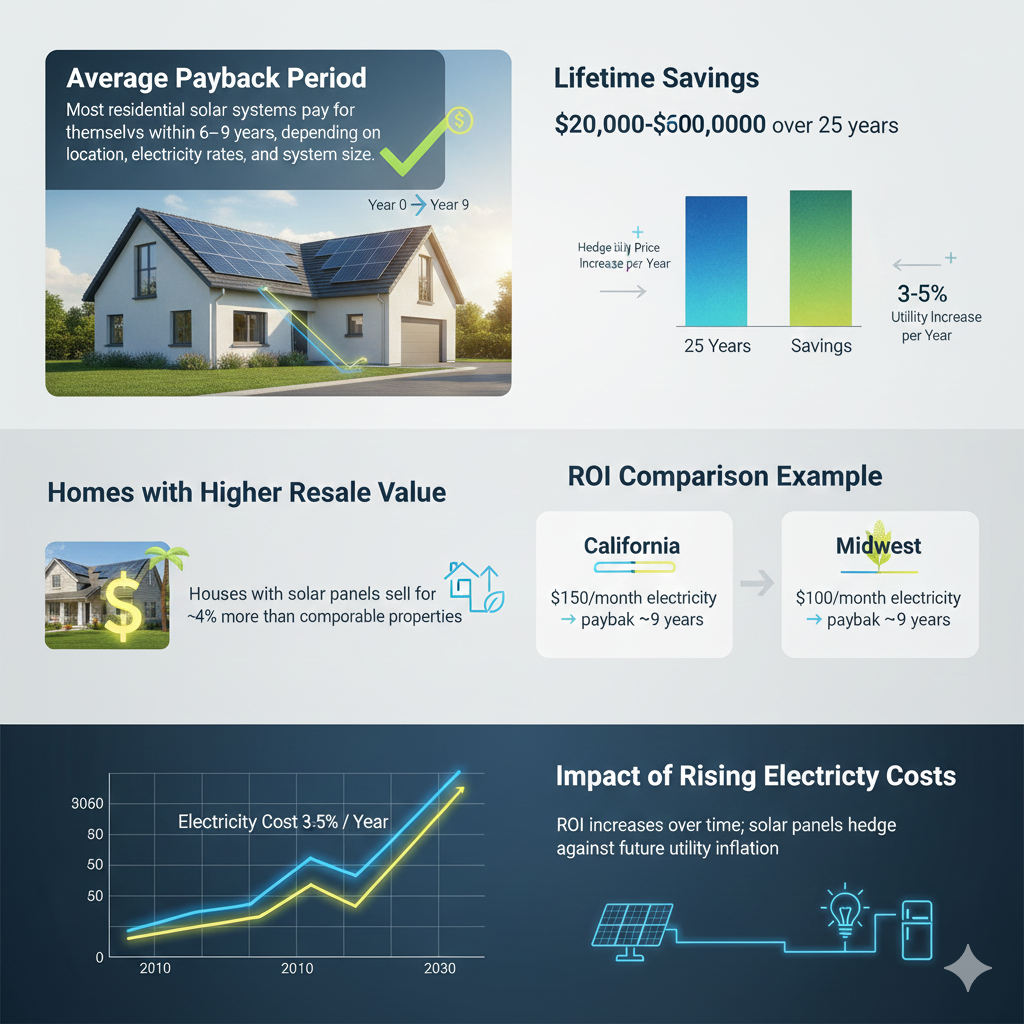
Average Payback Period
Most residential solar systems pay for themselves within 6 to 9 years to depend on your location, electricity rates and system size. The increased utility bills and the sunny climates are increasing the savings faster and the homeowners are enjoying energy independence much earlier.
Lifetime Savings
During the average 25-year life of a system, homeowners will be able to reduce their electricity bills by between $20000 and $60000. These savings are even more useful as electricity prices are rising at a rate of 3 to 5% making your solar panels a hedge against future utility price increases.
Homes with Higher Resale Value
Houses with solar panels sell for approximately 4% more than comparable properties. This premium is indicative of a long-term realization of energy savings by the buyer and a lesser carbon footprint, which would be an added financial benefit to the monthly savings.
ROI Comparison Example
The payment period of a California homeowner on the payments of electricity payments, currently standing at $150/month, is approximately 9 years, but courtesy of the high electricity rates and the generous incentives offered to solar users. In the Midwest, where average bills are lower at $100/month, payback is approximately 9 years. However, the investment still saves a lot in the long term.
Impact of Rising Electricity Costs
The home solar system ROI increases with time as utility rates continue to grow 3 to 5% a year. Not only is your system covering your current expenses, but it is also hedging you against the inflation of energy payments in the future, meaning that your solar investment will keep increasing in value over decades.
Regional Breakdown: Solar Installation Pricing in Different States
How does solar installation pricing vary across the US? System costs, incentives and return on investment are significantly impacted by location. Homeowners may make better decisions about their residential solar investments if they are aware of these differences.
-
Compare your costs with real-world output using solar panel output expectations
-
Understand lifetime value by reviewing solar panel lifespan averages.
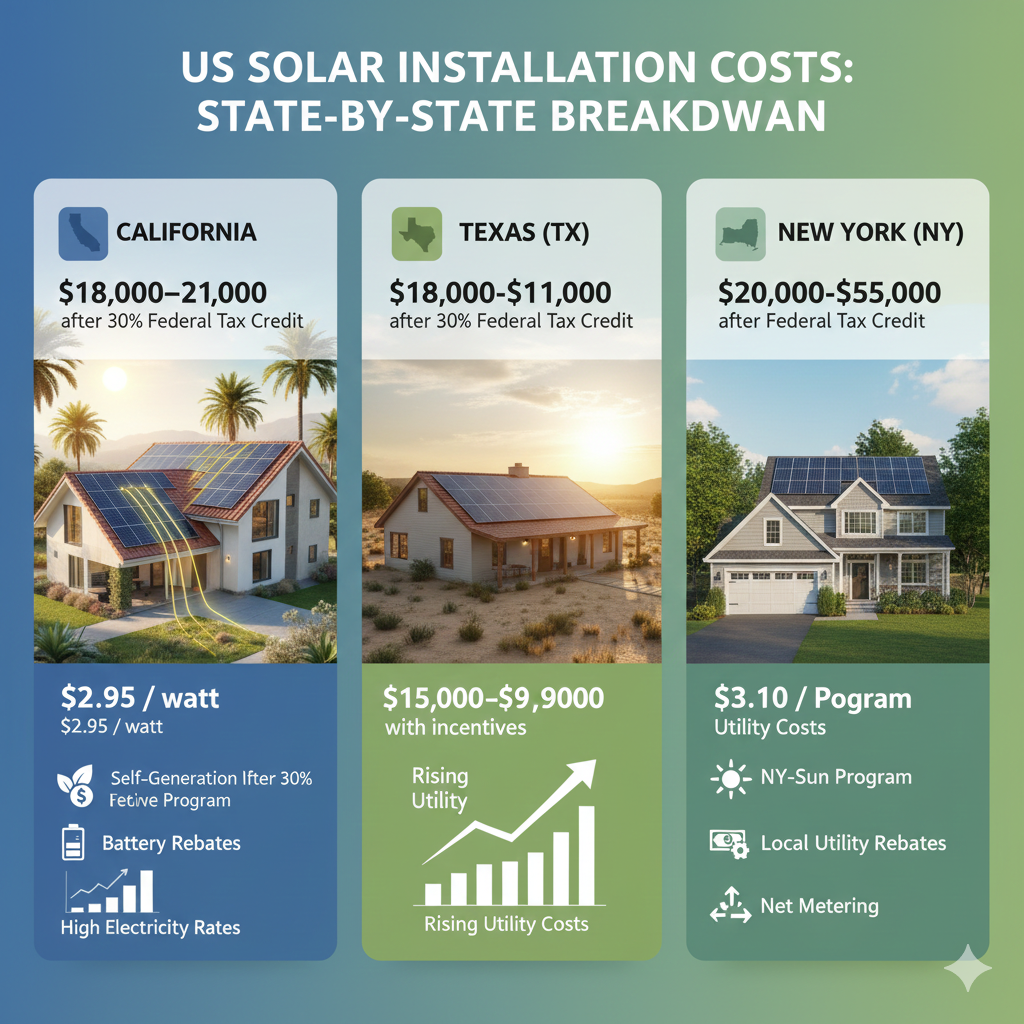
California
The solar panels are very marketable in California because of the high electricity prices. It is an average of $2.95 per watt, which will be $18000 to $21000 after the 30% federal tax credit. There is also the self-generation incentive program that provides extra rebates to battery storage systems to homeowners.
Texas (TX)
Installation is only a little cheaper in Texas, for $2.70 per watt, with an average system price of $15,000 to $19,000 with incentives. Though the state does not provide as many rebates as California, the solar potential is high, and the electricity rates are increasing, making it a great investment.
New York (NY)
The New York homeowners have a relatively high cost of $3.10 per watt with an average of $20,000-$25,000 after the Federal Tax Credit. Additional incentives are available under the NY-Sun program, and numerous local utilities also offer additional rebates and net metering credits, which increase ROI.
Solar Installation Pricing by State
| State | Avg. Cost per Watt | Avg. System Size | Cost After 30% Federal Tax Credit | State Incentives |
| CA | $2.95 | 6–7 kW | $18,000–$21,000 | SGIP battery rebates |
| TX | $2.70 | 6–7 kW | $15,000–$19,000 | Limited state rebates |
| NY | $3.10 | 6–7 kW | $20,000–$25,000 | NY-Sun + utility rebates |
Long-Term Value and Maintenance Costs
It is not only about short-term savings when investing in solar but also about long-term value. Among the most important aspects of a residential solar installation cost is the small amount of maintenance that is required. Regular maintenance such as cleaning of panels and replacement of inverters, is cheap, less than $1500 over 25 years and solar is a low-maintenance upgrade to the home.
Durable Panels with Long Lifespan
The average life of solar panels is 25–30 years, and the efficiency decreases only about half a percent per year. More than 80% of the panels continue to generate electricity even 25 years later, which guarantees you a constant payback on your investment.
Hedge Against Rising Utility Bills
The benefits of installing solar are that homeowners can protect against future electricity price hikes, which increase 3-5% on average per year. Such a long-term advantage increases the ROI of your residential solar investment and your solar system becomes both an energy investment and a financial investment.
Get Your Free, No-Obligation Quote
Stop guessing with national averages. Get a 100% free, personalized quote to see your *exact* system cost, incentives, and savings.
Are solar panels a good investment in 2026?
Is installing solar panels a sensible house renovation project?
+
Yes! Payback of high energy users may be realized in 6-7 years, and low energy users may take 8-9 years, but tax credits and incentives continue to make solar an intelligent long-term investment.
Why choose solar now?
+
Solar gives you power security, protects you against utility price hikes (3-5% yearly) and raises property value by an average of 4%.
What is the way can I estimate my savings?
+
You can use our free solar cost calculator or request a custom estimate to see the benefits of a residential solar investment for your home in 2026.
Take Action Today
Curious how much you can save? Use our free solar cost calculator or get a personalized estimate to view how a residential solar installation cost can specifically work in your home in 2026. Waiting is not an option, utility bills and incentives are subject to change and the sooner you switch to solar the sooner you start saving.
Conclusion
The residential solar installation cost is a smart, long-term residential investment and the cost of a solar installation is lower than ever today. Home solar systems are not simply an investment, but they can provide high ROI, lower utility bills and provide energy self-sufficiency.
You are about to calculate how much you might save. Get a free estimate or go through our website to invest in solar today. 30% federal solar tax credit